Workbook Experimental design
changing one thing at a time is the slow way to be wrong
If four things might affect your process, testing them one at a time takes longer, tells you less, and cannot see interactions at all — which is a problem, because interactions are usually where the answer is. Sixteen well-chosen runs beat sixty-four careless ones.

A factorial design tests every combination of your factors at once instead of one at a time. Four factors at two levels each is 16 runs, and from those you can measure all four main effects and all eleven interactions.
The one-at-a-time approach cannot do that at any sample size. If temperature only matters when pressure is high, changing temperature at low pressure tells you temperature does not matter — and you would be wrong, permanently.
Why one factor at a time cannot work
Suppose you are baking something and you want to know what makes it come out right. You suspect four things matter: temperature, time, how much yeast, and how long it rests.
The natural approach is to change one and hold the rest still. Temperature up, everything else fixed — better or worse? Then time. Then yeast. Then rest.
Two problems. First, you are spending all your runs learning about one factor at a time, so you need a lot of them.
Second, and much worse: you can only ever see each factor at whatever settings the others happened to be on. If more yeast only helps when the dough rests longer, and you tested yeast at a short rest, your experiment says yeast does not matter. That conclusion is wrong, it is confident, and nothing in your data will tell you so.
A factorial design tests every combination. Every factor is measured across the full range of every other factor, so an interaction shows up as an interaction instead of hiding as noise.
Does it actually recover the truth?
This is testable in a way most spreadsheets never are. The sample data is generated from a known model, so you can check whether the arithmetic recovers the effects that were deliberately put in.
| Term | True effect | Recovered | Detected by Lenth's method |
|---|---|---|---|
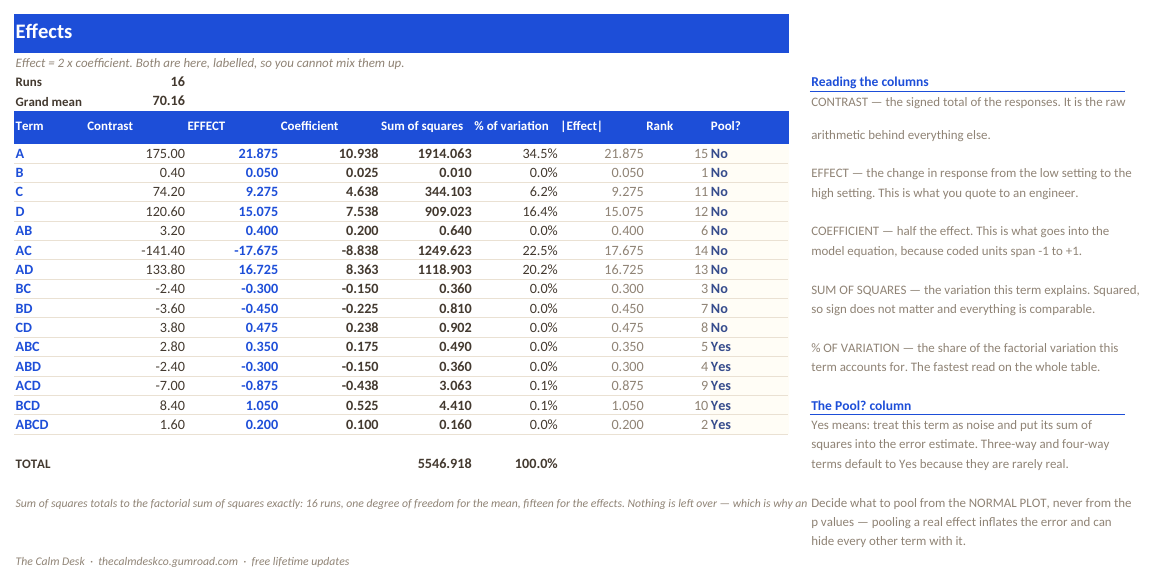
| A | 21.6 | 21.88 | Yes |
| C | 9.8 | 9.28 | Yes |
| D | 14.6 | 15.07 | Yes |
| AC | −18.8 | −17.68 | Yes |
| AD | 16.6 | 16.72 | Yes |
| B | 0.8 | 0.05 | No — correctly |
| Lenth's method flags | 5 real | 5 of 5 | and 0 of the 10 inert terms |
Note the last row. Factor B genuinely does nothing, the workbook recovers it as approximately nothing, and Lenth's method correctly declines to flag it. A method that finds everything is as useless as one that finds nothing — five out of five real effects and zero out of ten false positives is what a working method looks like.
Note also that two of the five real effects are interactions (AC and AD), and AC is negative. One-factor-at-a-time cannot find either.
Lenth's method, and why unreplicated designs need it
An unreplicated 2⁴ has 16 runs and 15 effects to estimate. That uses up every degree of freedom, so there is nothing left over to estimate the noise with — which means no standard significance test works.
Lenth's method solves it by assuming most effects are inert, and using the size of the small effects to estimate the noise. It runs in two passes so that large real effects cannot inflate the noise estimate and hide themselves:
s0  = 1.5 x median|effect|
PSE = 1.5 x median{ |effect| : |effect| < 2.5 x s0 }
It is the correct tool for this design and it is almost completely absent from spreadsheet templates, which is a large part of why this workbook exists. Both the margin of error and the simultaneous margin of error are reported — 1.446 and 2.935 on the shipped data.
The four centre points do a second job: they test for curvature. If the middle of your design space sits off the plane the corners define, a straight-line model is the wrong shape and you need a response surface design instead. On the shipped data curvature is not significant (F = 0.013), which is correct, because the data was generated from a linear-plus- interaction model.
How to run a 2^4 factorial experiment
Choose four factors and two levels each
Set the levels wide enough that a real effect will show, but inside the range you would actually run. Too narrow and everything looks inert; too wide and you learn about a process you never operate.
Run all sixteen combinations in random order
This matters more than it sounds. In standard order the last factor changes exactly once, halfway through — so anything that drifts over the session (a warming machine, a tiring operator, a settling batch) maps directly onto that factor and looks exactly like a real effect.
There is a run-order column, and Start Here is emphatic about it.
Add four centre points
Two jobs. They give you pure error, which the ANOVA needs. And they test curvature: if the middle sits off the plane the corners define, the model is the wrong shape.
Compute the effects, and keep effect and coefficient apart
effect = 2 x coefficient. Conflating them puts every prediction out by
a factor of two, and it is silent when it happens — the model still looks reasonable, it is
just wrong. Both are labelled columns here.
Separate signal from noise, then build the model
Real effects fall off the line on a normal plot; inert ones sit on it. Lenth's method gives you the same answer numerically.
The error term is built openly: pooled higher-order terms plus pure error from the centre points, with each component shown in the ANOVA table so it can be audited rather than taken on trust. There is a per-term pooling switch, so you decide what goes into error.
What is inside the file
Seven tabs. The response data is generated from a known model, which is what makes the recovery table above possible — you can verify the workbook finds the right answer because the right answer is known.
| Tab | What it does |
|---|---|
| Start Here | What to fill in, in what order, why run order matters, and how to import into Google Sheets. |
| Design | The 16-run design matrix in standard order, plus a run-order column and four centre points. |
| Effects | Contrast, effect, coefficient, sum of squares and percent of variation for all 15 terms, with a per-term pooling switch. |
| ANOVA | The analysis of variance, with the error term built openly from pooled terms and pure error. |
| Normal Plot | The normal probability plot of effects, plus Lenth's PSE with both margins of error. |
| Model | The fitted prediction equation from whichever terms you kept. |
| How It Works | Every calculation, including the two-pass Lenth procedure. |
Opening it in Excel, Google Sheets or Numbers
It is one .xlsx file. There are no macros, no add-ins and nothing to install, which is what makes it portable — a macro-driven template would be Excel-only.
| App | How to open it |
|---|---|
| Microsoft Excel | Double-click the file. Excel 2016 and later, and Microsoft 365, on Windows or Mac. Nothing to enable and nothing to install. |
| Google Sheets | Go to Google Drive, click New → File upload and pick the .xlsx. Then double-click it in Drive and choose Open with → Google Sheets. To keep a native copy, use File → Save as Google Sheets. Formatting and formulas both carry over. |
| Apple Numbers (Mac, iPad, iPhone) | Numbers opens .xlsx directly — double-click it, or in Numbers use File → Open and select the file. Numbers converts it on open and will list anything it changed. To send a copy back to someone on Excel, use File → Export To → Excel. |
| LibreOffice Calc | Free, and opens the file as-is on Windows, Mac and Linux. This is what I use to recalculate every workbook when I check the maths, so it is the app these files are tested hardest in. |
This one leans on FDIST, MEDIAN, NORMSINV, RANK and TINV — the functions people most often worry about losing in another app. All of them exist in Excel, Google Sheets, Apple Numbers and LibreOffice Calc, so the file works the same in all four.
Get the workbook
$69 one-off · no subscription
- One .xlsx file, seven tabs, works in Excel, Google Sheets, Numbers and LibreOffice
- A complete 2^4 design with 16 runs and 4 centre points
- All 15 effects with a per-term pooling switch
- Lenth's PSE — the correct test for an unreplicated design, and rare in templates
- A curvature test that tells you when a linear model is the wrong shape
- Free lifetime updates
Instant download from Gumroad. No add-in and no macros. The Analysis ToolPak is not required.
The arithmetic, written out
contrast    = sum of (sign x response) across all 16 runs
effect      = contrast / 8            # for a 2^4
coefficient = effect / 2
SS          = contrast^2 / 16

s0          = 1.5 x median|effect|
PSE         = 1.5 x median{ |effect| : |effect| < 2.5 x s0 }
ME          = t(0.975, d) x PSE
SME         = t(gamma, d) x PSE

curvature F = (mean of corners - mean of centre points)^2 scaled / pure error
The two-pass structure in Lenth's method is the point of it. The first pass gets a rough scale from all the effects; the second recomputes it using only effects small enough to plausibly be noise. Without that second pass, a few large real effects inflate the noise estimate enough to hide themselves.
How I know the numbers are right
The checker does two different things, because a workbook can be perfectly self-consistent and still wrong. It reimplements every calculation independently in Python and diffs. And because the response data is generated from a known model, it also checks that the arithmetic recovers that model.
Last run: 0 numeric mismatches, 0 property failures, 0 formula errors.
- effect = 2 × coefficient, for all 15 terms
- The 15 sums of squares add exactly to the factorial total (16 runs = 1 df mean + 15 df effects)
- The design is orthogonal — all 105 column pairs have zero dot product
- Lenth's method flags all 5 real effects and zero of the 10 inert ones (ME 1.446, SME 2.935)
- Curvature is not significant (F = 0.013) on data generated from a linear-plus- interaction model — a curvature test that fires on linear data is broken
Compared with the alternatives
| Cost | Interactions | Lenth's method | Curvature test | |
|---|---|---|---|---|
| This workbook | $69 | All 11 | Yes | Yes |
| One factor at a time | $0 | None — cannot see them | N/A | No |
| Minitab / JMP | $2,000+ / year | Yes | Yes | Yes |
| A free DOE template | $0 | Sometimes | Almost never | Rarely |
Questions people ask before buying
What is a 2^4 factorial design?
An experiment testing four factors at two levels each — every combination, so 16 runs. From those you get all four main effects and all eleven interactions.
Why not change one factor at a time?
Because it needs more runs and it cannot detect interactions at all. If factor A only matters when factor B is high, testing A at low B tells you A does not matter — a confident, wrong answer your data will never contradict.
What is Lenth's method for?
An unreplicated 16-run design spends every degree of freedom estimating its 15 effects, leaving nothing to estimate noise with. Lenth's method estimates the noise from the size of the small effects instead, in two passes so that large real effects cannot hide themselves.
What are the centre points for?
Two things: they give you pure error for the ANOVA, and they test for curvature. If the middle of the design space sits off the plane the corners define, a linear model is the wrong shape.
Why does run order matter so much?
In standard order the last factor changes exactly once, halfway through. Anything drifting over the session maps straight onto that factor and looks like a real effect. Randomise, and use the run-order column.
Does it need the Analysis ToolPak?
No. Everything is native formulas, which is why it works in Google Sheets and Numbers as well.
How do I know the maths is right?
The sample response data is generated from a known model, so the workbook's answers can be checked against the truth. It recovers all five real effects and correctly finds nothing in the inert factor.
Will it work in Google Sheets?
Yes. It uses FDIST, TINV and NORMSINV, all of which Google Sheets and Apple Numbers support.
Related spreadsheets
Ready to stop doing this by hand?
$69 one-off · no subscription
- One .xlsx file, seven tabs, works in Excel, Google Sheets, Numbers and LibreOffice
- A complete 2^4 design with 16 runs and 4 centre points
- All 15 effects with a per-term pooling switch
- Lenth's PSE — the correct test for an unreplicated design, and rare in templates
- A curvature test that tells you when a linear model is the wrong shape
- Free lifetime updates
Instant download from Gumroad. No add-in and no macros. The Analysis ToolPak is not required.