Calculator Equipment costing
the machine costs money on the days it sits still
A digger parked in the yard is still depreciating, still insured, still financed and still taxed. Those costs do not care how many hours it worked. Which means the fewer hours you use it, the more each of those hours costs — and below a certain point, renting is simply cheaper.
A machine has two kinds of cost. Fixed costs — depreciation, interest, insurance, tax, storage — happen every year whether it moves or not. Operating costs — fuel, tyres, repairs — only happen when it works.
Divide the fixed cost by the hours you actually use it, add the operating cost per hour, and you have the true hourly cost. Compare that against the rental rate and you get a break-even: the number of hours a year below which owning the machine is the more expensive choice.
Why low hours make a machine expensive
Say a machine costs you $40,000 a year to own before it turns a wheel — depreciation, the loan, insurance, tax, somewhere to keep it.
Work it 2,000 hours a year and that is $20 an hour. Work it 500 hours and the same $40,000 becomes $80 an hour. The machine did not change. Your utilisation did.
This is why the machine you bought because “we needed one on that job” can be the most expensive thing in the yard. It is not costing you anything visible — there is no invoice for a parked digger — but the depreciation is happening regardless, and the hours it is not working are hours that cost is not being spread over.
In the sample fleet, three machines out of eight fall below their break-even. The dozer runs 640 hours a year and costs $184 an hour owned against $111 an hour rented.
The three machines that should not be owned
An eight-machine sample fleet, $1.59M of equipment. Five machines earn their keep. Three do not, and the workbook says so.
| Machine | Hours per year | Cost per hour owned | Cost per hour rented | Verdict |
|---|---|---|---|---|
| Dozer | 640 | $184 | $111 | RENT |
| Telehandler | 520 | — | — | RENT |
| Roller | 380 | — | — | RENT |
| Avoidable cost across the three | $43,010 / year |
$43,010 a year, on three machines nobody thought were a problem, because a parked machine never sends you a bill. The other five come out as OWN — this is not an argument against owning equipment, it is an argument for knowing which ones.
The modelling mistake I made first, and had to undo
My first version costed depreciation per hour. It seemed reasonable: more hours, more wear, more depreciation.
It is wrong, and it broke the product. Costing depreciation per hour makes it a variable cost that scales with use — which means the “annual fixed cost” is no longer fixed, and the whole own-versus-rent comparison stops meaning anything. The verifier caught it: at the computed break-even hours, owning and renting differed by up to $5,192 when by definition they should have been equal.
Depreciation is time-based. A machine loses value sitting in the yard. The model was restructured so depreciation runs per year, interest uses life in years directly, and repairs are direct per-hour inputs rather than factors on hourly depreciation. After that the identity holds at $0.0000 for every machine.
How to work out what a machine really costs per hour
Work out the annual fixed cost
Depreciation is per year, not per hour: purchase price less residual, divided by life in years. Interest uses the average annual investment. Insurance, tax and storage are annual figures.
Tyres and undercarriage are deliberately excluded from the depreciable base and costed over their own life instead — they wear out several times over a machine's life, so treating them as part of the machine understates both.
Work out the operating cost per hour
All of these are per-hour by nature — they only happen when the machine runs. Repairs are entered as a direct $/hr input rather than derived as a factor on depreciation, because a machine does not wear faster per hour just because it works fewer hours.
Divide the fixed cost by the hours you actually use it
Be honest about the hours. This is the input that decides the answer, and it is the one people inflate. The Utilisation tab shows the whole curve, so you can see how sharply the cost per hour climbs as hours fall.
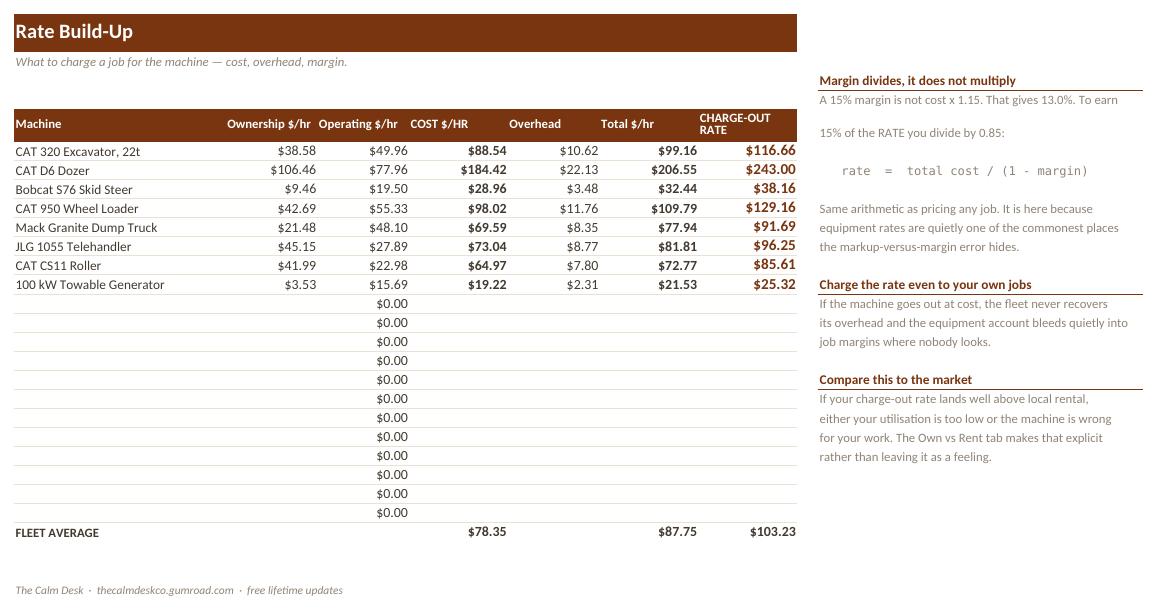
Build the charge-out rate
rate = (cost per hour + overhead) / (1 - margin)Margin divides, exactly as in the bid calculators. Multiplying gives you a smaller margin than you asked for.
Compare against renting, and only strip what a renter avoids
break-even hours = fixed / (rental per hour - tyres - repairs - GET)Fuel and lubricants are not subtracted. You buy those either way, whether the machine is yours or rented, so removing them would double-count and always flatter renting.
Rental is priced by time: the effective rental rate is the monthly rate divided by the hours a rented machine really delivers in a month. That divisor is an input — 130 in the sample, not 173 — because it quietly decides the whole answer.
What is inside the file
Nine tabs around an eight-machine sample fleet worth $1.59M, tuned so the answer is genuinely mixed: five machines to own, three to rent.
| Tab | What it does |
|---|---|
| Start Here | What to fill in, in what order, and how to import the file into Google Sheets. |
| Rates | Interest, insurance, tax, storage, fuel price, overhead and margin — set once. |
| Fleet | Your machines: purchase price, residual, life, annual hours and rental rates. |
| Ownership Cost | The annual fixed cost per machine — depreciation, interest, insurance, tax, storage. |
| Operating Cost | Fuel, lubricants, tyres, repairs and ground engaging tools, per working hour. |
| Rate Build-Up | Cost per hour, plus overhead, plus margin, giving the rate to charge. |
| Own vs Rent | Break-even hours per machine and a verdict, machine by machine. |
| Utilisation | How cost per hour changes as annual hours change, across the whole fleet. |
| How It Works | Every formula, including why depreciation is time-based. |
Opening it in Excel, Google Sheets or Numbers
It is one .xlsx file. There are no macros, no add-ins and nothing to install, which is what makes it portable — a macro-driven template would be Excel-only.
| App | How to open it |
|---|---|
| Microsoft Excel | Double-click the file. Excel 2016 and later, and Microsoft 365, on Windows or Mac. Nothing to enable and nothing to install. |
| Google Sheets | Go to Google Drive, click New → File upload and pick the .xlsx. Then double-click it in Drive and choose Open with → Google Sheets. To keep a native copy, use File → Save as Google Sheets. Formatting and formulas both carry over. |
| Apple Numbers (Mac, iPad, iPhone) | Numbers opens .xlsx directly — double-click it, or in Numbers use File → Open and select the file. Numbers converts it on open and will list anything it changed. To send a copy back to someone on Excel, use File → Export To → Excel. |
| LibreOffice Calc | Free, and opens the file as-is on Windows, Mac and Linux. This is what I use to recalculate every workbook when I check the maths, so it is the app these files are tested hardest in. |
Every formula in this workbook uses ordinary functions — SUM, IF, INDEX, MATCH and their relatives. Nothing here is Excel-only.
Get the workbook
$89 one-off · no subscription
- One .xlsx file, nine tabs, works in Excel, Google Sheets, Numbers and LibreOffice
- An eight-machine sample fleet with a genuinely mixed own/rent answer
- Time-based depreciation, so the break-even actually balances
- Break-even hours and a verdict per machine
- A utilisation curve showing how fast low hours hurt
- Free lifetime updates
Instant download from Gumroad. Operator wages are excluded by design, and it says so on Start Here.
The arithmetic, written out
annual fixed     = depreciation/yr + interest + insurance + tax + storage
fixed per hour   = annual fixed / annual hours
total per hour   = fixed per hour + operating per hour
charge-out rate  = (total per hour + overhead) / (1 - margin)
break-even hours = annual fixed / (rental/hr - tyres - repairs - GET)
Two things in that last line are easy to get wrong and both always favour renting if you do.
Only subtract what a renter genuinely avoids. Fuel and lubricants are bought either way, so they cancel. Comparing a full ownership rate against a bare rental rate double-counts them.
Rental is priced by time, not by the hour. The effective rental rate is the monthly rate divided by the hours a rented machine really delivers — 130 a month in the sample, not the 173 that a full month of eight-hour days would suggest.
How I know the numbers are right
The verifier reimplements the model in Python, recalculates the workbook, and asserts the identity that is the product: at the computed break-even hours, the annual cost of owning must equal the annual cost of renting. If those two are not equal at the break-even, the verdict is guesswork.
Last run: 0 numeric mismatches, 0 property failures, 0 formula errors. Worst gap at break-even: $0.0000.
- Depreciation per year × life in years equals the depreciable base — exact
- Ownership per hour × hours equals annual fixed cost — exact
- The utilisation grid matches fixed-per-hour plus operating — all 8 machines × 8 steps
- Rate × (1 − margin) equals cost plus overhead — margin divides, never multiplies
- Both OWN and RENT verdicts appear in the sample data — 5 and 3
- The avoidable-cost figure matches: 3 machines, $43,010
Compared with the alternatives
| Cost | Depreciation | Break-even balances | Own/rent verdict | |
|---|---|---|---|---|
| This workbook | $89 | Time-based | To $0.0000 | Per machine |
| A free equipment cost sheet | $0 | Usually per hour | Not checked | No |
| Fleet management software | $200–$800 / month | Correct | Yes | Yes |
| The manufacturer's rate guide | $0 | Generic | No | No |
Questions people ask before buying
Why is depreciation per year rather than per hour?
Because a machine loses value sitting in the yard. Costing it per hour makes it a variable cost that scales with use, which means annual fixed cost is no longer fixed — and the own-versus-rent break-even stops balancing. I built it the wrong way first and the verifier caught it, with gaps up to $5,192.
What are break-even hours?
The annual hours below which renting the machine costs less than owning it. Below the break-even the fixed costs are being spread over too few hours.
Why is fuel not subtracted in the break-even?
Because you buy fuel whether the machine is yours or rented, so it cancels out. Subtracting it would double-count and make renting look better than it is.
Does it include the operator's wages?
No, deliberately, and Start Here explains why. You either charge a labour rate or a machine rate; including wages in both is the most common way to double-charge a customer.
How many machines does it handle?
Eight are filled in as a sample fleet worth $1.59M. You add rows the normal way.
Will it work in Google Sheets?
Yes. Upload the .xlsx to Google Drive and open it with Google Sheets. No macros, no add-ins.
Can I use it on a Mac without Excel?
Yes. Apple Numbers opens the file directly, and LibreOffice Calc is free.
How do I set the rental hours divisor?
It is the hours a rented machine really delivers in a month, and it is an input because it quietly decides the whole answer. The sample uses 130 rather than a theoretical 173.
Related spreadsheets
Ready to stop doing this by hand?
$89 one-off · no subscription
- One .xlsx file, nine tabs, works in Excel, Google Sheets, Numbers and LibreOffice
- An eight-machine sample fleet with a genuinely mixed own/rent answer
- Time-based depreciation, so the break-even actually balances
- Break-even hours and a verdict per machine
- A utilisation curve showing how fast low hours hurt
- Free lifetime updates
Instant download from Gumroad. Operator wages are excluded by design, and it says so on Start Here.