Workbook Construction finance
the construction WIP schedule, explained simply
A WIP schedule answers one question: you are halfway through a job — how much have you actually earned? Get it right and your bank, your bonding agent and your accountant all trust your numbers. Get it wrong and you find out in the worst possible month.
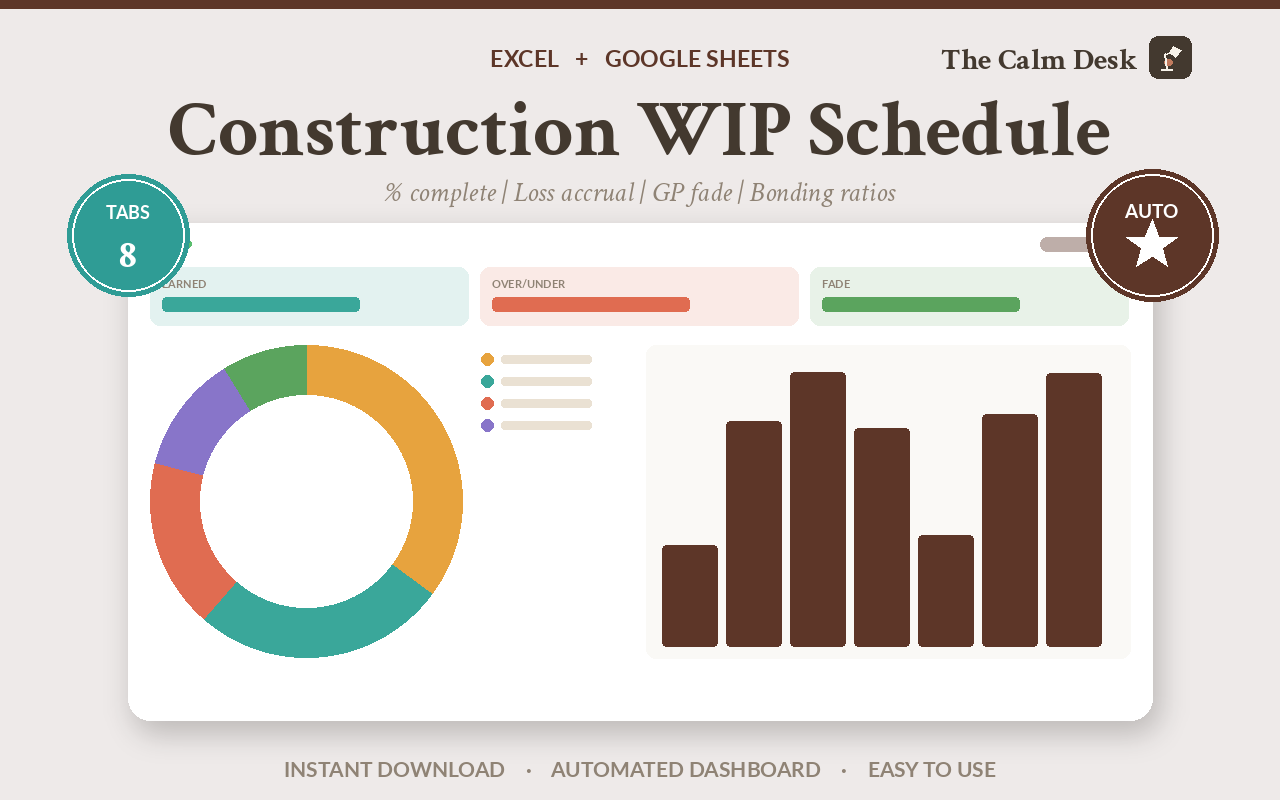
A WIP (work-in-progress) schedule works out how much of each job you have earned so far, which is almost never the same as how much you have billed. You divide what a job has cost you so far by what you expect it to cost in total. That gives you a percent. You have earned that percent of the contract.
The one place it stops being simple: if a job is going to lose money, you must record the whole loss straight away — not the share of it matching your progress. This workbook does that, and it checks that its own totals match your profit and loss statement.
What a WIP schedule is, in plain words
Imagine you agree to paint a fence for $100. You think it will cost you $60 in paint and time. You are halfway done and you have spent $30.
How much have you earned? Not $100 — you have not finished. Not $0 — you have done real work. You have spent half of what you expected to spend, so you are half done, so you have earned $50.
That is the whole idea. Cost is the measuring stick, because cost is the thing you can count. Now do it for twelve jobs at once, every month, with money going out and invoices going in at different times, and you need a schedule instead of a paragraph.
The second thing it tells you is whether you have billed ahead of the work or behind it. If you have earned $50 and billed $70, you are over-billed by $20 — that $20 is not profit, it is money you owe in work. If you billed $40, you are under-billed by $10, and you have quietly lent the customer $10.
The mistake that costs the most
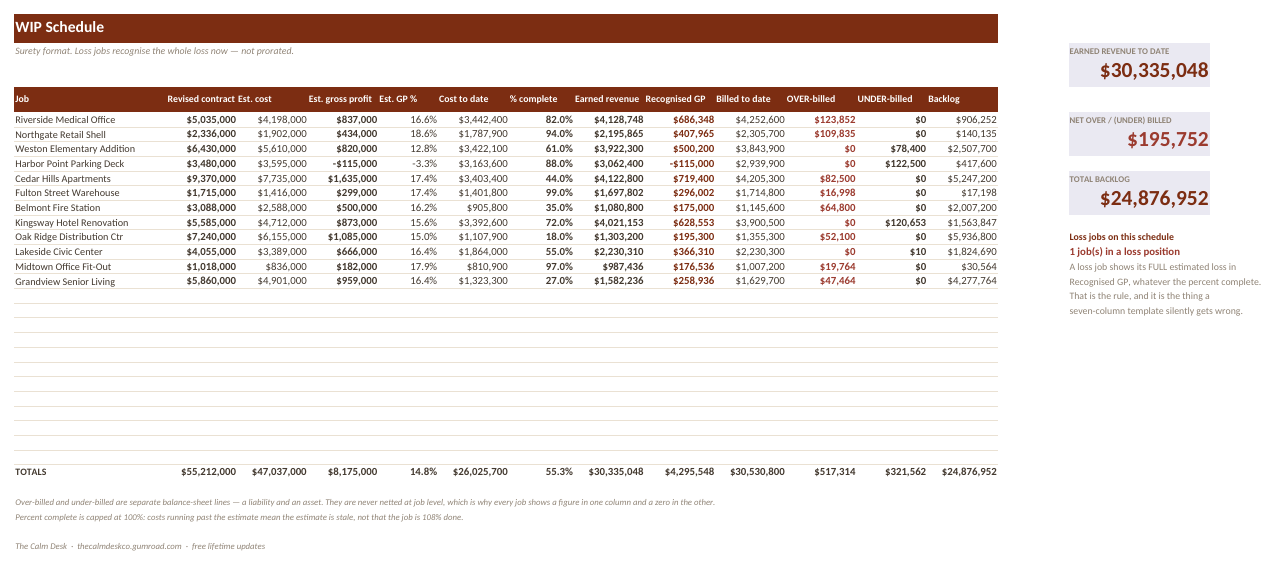
One job in the sample data is going to lose money. Harbor Point Parking Deck: the contract is worth $3,480,000, and it is now going to cost $3,595,000. That is a $115,000 loss, and the job is 88% complete.
Almost every free seven-column template will spread that loss across the job like it spreads profit — 88% of it now, the rest later. That is the wrong rule. The moment you can see a job will lose money, the entire loss belongs in this period.
| Loss recognised now | Still to come | Is it right? | |
|---|---|---|---|
| The rule: full loss immediately | −$115,000 | $0 | Correct. You know about the loss now, so you report it now. |
| What a prorated template does | −$101,200 | −$13,800 | Wrong. It hides $13,800 of a loss you already know about. |
| Overstatement, one job | $13,800 | On a portfolio of 12 jobs |
$13,800 on one job sounds survivable. The problem is what it does to everything downstream: your gross profit is too high, so your income statement is too high, so the bonding capacity you calculate off that equity is too high — and you bid work on the strength of a number that was never real.
Why this one rule is the whole product
The arithmetic in a WIP schedule is genuinely easy. Divide, multiply, subtract. If that were all of it, a free template would be fine and this page would not exist.
What is hard is that a loss job follows a different rule from a profitable one, and a spreadsheet has to decide which is which on every job, every month, without you remembering to check. That is the branch below, and it is the thing a seven-column template does not have.
How to build a WIP schedule that reconciles
Write down what each job is worth now
Original contract, plus every approved change order. Not the ones you have asked for — the ones that have been signed. That total is the revised contract, and everything else on the schedule is measured against it.
Write down two cost estimates, not one
This is the step people skip, and it is the one that pays for the workbook. Keep the estimate at award in its own column and never overwrite it. Keep your estimate now beside it.
If you only keep one, you have thrown away the only record of what you believed when you signed, and you can never see a job slowly getting worse.
Work out how far along each job is
Cost to date ÷ estimated cost now = percent complete.
Cap it at 100%. If a job has spent 108% of its estimate, that does not mean it is 108% built. It means the estimate is stale. The workbook caps it and the Fade Analysis tab is where that stale estimate shows up.
Turn the percent into earned revenue, then check for a loss
Revised contract × percent complete = earned revenue. Earned revenue − cost to date = gross profit.
Then the test that matters: is estimated cost now greater than the revised contract? If yes, this job is in a loss position, and the full loss goes in this period. The workbook applies that automatically and counts the loss jobs at the top of the schedule so you cannot miss one.
Make it tie to your profit and loss statement
A WIP that produces plausible numbers and does not reconcile is worth nothing. The Tie-Out tab compares period revenue and period cost against your P&L and refuses to print “reconciled” unless both variances are under $1. If they are not, it names the three usual causes rather than leaving you to hunt.
What is inside the file
Eight tabs. You type into two of them. The sample data is a realistic twelve-job contractor — $55.2M of revised contracts, $30.3M earned, $24.9M of backlog — so you can see every tab working before you put your own jobs in.
| Tab | What it does |
|---|---|
| Start Here | What to fill in, in what order, and how to import the file into Google Sheets. |
| Contracts | Your job list. Contract value, change orders, both cost estimates, cost to date, billed to date. This is the tab you type into. |
| WIP Schedule | The schedule itself. Percent complete, earned revenue, gross profit, and the over-billed and under-billed split for every job. |
| Roll-Forward | This month against last month, so you can see what actually moved rather than just where things stand. |
| Fade Analysis | Compares the gross profit you expected at award with what you expect now, job by job. This is where a job going quietly wrong becomes visible. |
| Tie-Out | Checks the schedule against your income statement and refuses to say reconciled if either variance is over $1. |
| Bonding | Working capital and equity, and the indicative multiples a surety looks at. |
| How It Works | Every formula on the schedule, written out and explained. |
Opening it in Excel, Google Sheets or Numbers
It is one .xlsx file. There are no macros, no add-ins and nothing to install, which is what makes it portable — a macro-driven template would be Excel-only.
| App | How to open it |
|---|---|
| Microsoft Excel | Double-click the file. Excel 2016 and later, and Microsoft 365, on Windows or Mac. Nothing to enable and nothing to install. |
| Google Sheets | Go to Google Drive, click New → File upload and pick the .xlsx. Then double-click it in Drive and choose Open with → Google Sheets. To keep a native copy, use File → Save as Google Sheets. Formatting and formulas both carry over. |
| Apple Numbers (Mac, iPad, iPhone) | Numbers opens .xlsx directly — double-click it, or in Numbers use File → Open and select the file. Numbers converts it on open and will list anything it changed. To send a copy back to someone on Excel, use File → Export To → Excel. |
| LibreOffice Calc | Free, and opens the file as-is on Windows, Mac and Linux. This is what I use to recalculate every workbook when I check the maths, so it is the app these files are tested hardest in. |
Every formula in this workbook uses ordinary functions — SUM, IF, INDEX, MATCH and their relatives. Nothing here is Excel-only.
Get the workbook
$119 one-off · no subscription
- One .xlsx file, eight tabs, works in Excel, Google Sheets, Numbers and LibreOffice
- Twelve jobs of realistic sample data so you can see it working before you touch it
- Loss jobs handled correctly and counted for you
- A tie-out that will not lie to you about reconciling
- Free lifetime updates
Instant download from Gumroad. No subscription, no account, no macros.
The arithmetic, written out
Five lines. Written out so you can check the workbook rather than trust it.
percent complete   = MIN(1, cost to date / estimated cost now)
earned revenue     = revised contract * percent complete
gross profit       = earned revenue - cost to date
over-billed        = MAX(0, billed to date - earned revenue)
under-billed       = MAX(0, earned revenue - billed to date)
And the rule that is not in that list, because it is a condition rather than a formula:
if estimated cost now > revised contract:
    gross profit = revised contract - estimated cost now     # the FULL loss, now
Two details worth naming. Over-billed and under-billed are never netted at job
level — they are two different lines on a balance sheet, one a liability and one an asset, so
every job shows a figure in one column and a zero in the other. And percent complete is
capped, which is the MIN(1, …) above.
How I know the numbers are right
I do not trust a spreadsheet because it looks right. Every workbook in this line has a checker next to it that reimplements the whole thing from scratch in Python, recalculates the real file in LibreOffice, and compares the two. For this one it also asserts eight identities — things that must be true of any correct WIP, and that would be false of a broken one:
- Period revenue across all jobs equals income-statement revenue
- Period cost equals cost of revenue
- Total over-billings minus under-billings equals total billed minus total earned
- No job is both over-billed and under-billed
- Every loss job carries its full estimated loss
- No job exceeds 100% complete
- Earned plus backlog equals the revised contract, per job and in total
- There is real fade in the sample data — a fade analysis with nothing fading is untested
Last run: 0 numeric mismatches, 0 property failures, 0 formula errors. The sample portfolio fades 2.5 points, from 17.33% gross margin at award to 14.81% now, across 8 of the 12 jobs — enough to trip the workbook's systematic-fade verdict, which is the point of shipping data that is not tidy.
Compared with the alternatives
| Cost | Loss jobs | Ties to the P&L | Fade analysis | |
|---|---|---|---|---|
| This workbook | $119 | Full loss, automatically | Yes, refuses to fake it | Yes |
| A free seven-column template | $0 | Prorated — wrong | No | No |
| Construction accounting software | $200–$600 / month | Correct | Yes | Usually |
| Your accountant builds it | $1,500–$5,000 once | Correct | Yes | If you ask |
Questions people ask before buying
What is a WIP schedule in simple terms?
It is a table that works out how much of each job you have actually earned so far, based on how much of the expected cost you have spent. It also shows whether you have invoiced more than you have earned, or less.
Why does a loss job get treated differently?
Because a loss is not something you earn gradually. As soon as you can see that a job will cost more than it pays, that whole loss is a fact you already know, so accounting rules say you report all of it now. Profit is different: you only earn that as you do the work.
Does this reproduce a specific accounting form?
No. It produces the figures a WIP schedule needs, in the layout a surety and a bank expect to see. It is not a facsimile of any copyrighted form.
Will it work in Google Sheets?
Yes. Upload the .xlsx to Google Drive and open it with Google Sheets. Every formula in this workbook uses ordinary functions, so nothing is lost in the conversion.
Can I use it on a Mac without Excel?
Yes. Apple Numbers opens the .xlsx directly, and LibreOffice Calc is free and opens it too. LibreOffice is what I use to recalculate the file when I check the maths.
How many jobs does it handle?
It ships sized for a contractor running a couple of dozen jobs at once, with twelve filled in as an example. You add rows the normal way; the formulas copy down.
Do I need to know accounting to use it?
You need to know your own job costs. The workbook explains every rule it applies on the How It Works tab, in the same plain terms as this page.
What are the bonding multiples?
Indicative planning figures — roughly 10 times working capital for a single job and 20 times in aggregate. They are labelled as indicative everywhere they appear. Your surety sets your real capacity, not a spreadsheet.
Related spreadsheets
Ready to stop doing this by hand?
$119 one-off · no subscription
- One .xlsx file, eight tabs, works in Excel, Google Sheets, Numbers and LibreOffice
- Twelve jobs of realistic sample data so you can see it working before you touch it
- Loss jobs handled correctly and counted for you
- A tie-out that will not lie to you about reconciling
- Free lifetime updates
Instant download from Gumroad. No subscription, no account, no macros.