Forecast Construction finance
profitable jobs can still run you out of money
Every job in this forecast makes money. All eight of them. And in month 19 the business is still $2.2 million in the hole, because you pay for work months before anyone pays you for it. Profit and cash are different questions, and only one of them can bankrupt you.
A cash flow forecast works out, month by month, when money actually leaves and arrives — not when it is earned. You pay wages this month, materials next month and subcontractors the month after. The customer pays you a month or two after you invoice, and holds retainage back for months after that.
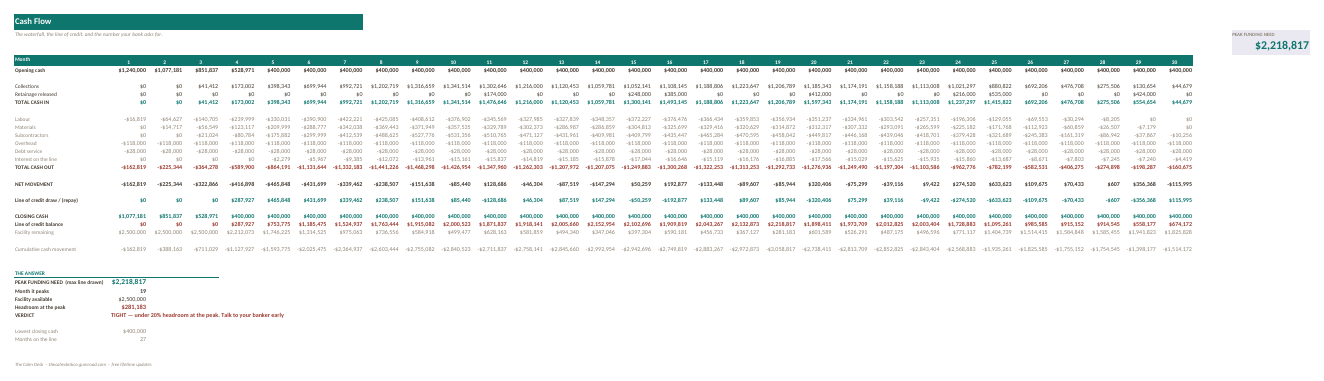
The gap between those two timings is your peak funding need: the largest amount you will ever be out of pocket. On the sample scenario — an $11M-a-year contractor running eight profitable jobs — it is $2,218,817, in month 19.
Why a profitable business runs out of money
Think about a single job. In month one you pay your crew. In month two you pay for materials you ordered in month one. In month three the subcontractor's invoice falls due.
Meanwhile you invoice the customer at the end of month one. They pay in month two, or month three. And they keep 10% back as retainage, which you might see six months after the job finishes.
So the money goes out first and comes back later. Always. On one job that is a manageable dip. Now start a second job before the first finishes, and a third, and a fourth — which is what growing looks like — and the dips stack on top of each other.
This is why contractors fail in good years. Every job is profitable and the business still cannot make payroll, because profit is a fact about the whole job and payroll is a fact about Friday.
The sample scenario, and where it nearly breaks
Eight staggered jobs, $27.56M of contracts, $3.57M of gross profit. Every job profitable. Here is what the cash position does anyway.
| Amount | What it means | |
|---|---|---|
| Gross profit across all eight jobs | $3,570,000 | The business is genuinely profitable. |
| Peak amount drawn on the credit line | $2,218,817 | Month 19. The most you are ever out of pocket. |
| Facility available | $2,500,000 | What the bank agreed to lend. |
| Headroom at the peak | $281,183 | 11% — the workbook flags this as TIGHT. |
Eleven percent headroom on a facility, in a scenario where nothing has gone wrong yet. One job slipping a month, or one owner paying late, and the line is exhausted. That is the number you want to know before you sign the fifth job, and it is why the Stress Test tab exists.
The timing details that decide the answer
A forecast that averages everything into one lag gives a smooth, comfortable and useless curve. The trough forms in the details.
Costs are paid on three different timings. Labour in the month it happens — payroll does not wait. Materials a month later. Subcontractors two months later. Average those into one number and you flatten out exactly the part that hurts.
Revenue follows an S-curve, not a straight line. Jobs start slowly, run hard through the middle and taper. A straight line understates the middle of a job, which is precisely where the cash trough forms.
Retainage comes back as a lump, months later. Not as part of ordinary collections. Treating it as a normal receivable makes the forecast look far healthier than it is.
How to forecast construction cash flow
Lay out the jobs on a timeline
Eight jobs ship in the sample, deliberately staggered. Overlap is the whole point: one job at a time never breaks anyone.
Spread revenue along an S-curve
progress(t) = t^n / (t^n + (1-t)^n)n is an input. n=1 is a straight line, n=2 is a standard S-curve. The shape matters because a straight line understates the middle of the job, and the middle is where the trough is.
Set when the money actually arrives
The split lag is there because real customers are not uniform — some pay on terms, some do not. Retainage is released separately, as one lump per job, months after completion.
Set when the money actually leaves
Three timings, not one. This is the step that turns a comfortable forecast into an honest one.
Add the credit line and read the peak
The facility is a hard ceiling. If a scenario needs more, the balance pins at the limit and cash drops below the floor — which is the signal you want, rather than a model that silently borrows infinite money.
Peak funding need is the peak drawn balance, not the lowest cash balance. Those differ, because a real operator holds cash at the minimum and borrows the rest.
What is inside the file
Eight tabs across a 30-month horizon. The sample is an $11M-a-year general contractor with eight staggered jobs, sized so the credit line is genuinely tight.
| Tab | What it does |
|---|---|
| Start Here | What to fill in, in what order, and how to import the file into Google Sheets. |
| Assumptions | Collection lags, cost payment timings, retainage rate and release, S-curve shape, facility size and cash floor. |
| Jobs | Each job's contract value, cost, start month and duration. |
| Revenue & Billing | Revenue spread along the S-curve, and what gets invoiced each month. |
| Costs & Payments | Labour, material and subcontractor costs, each on their own payment timing. |
| Cash Flow | The month-by-month position, with credit line draws and repayments, and the peak funding need. |
| Stress Test | What happens when jobs slip, customers pay late, or costs run over. |
| How It Works | Every formula, including the S-curve and the credit line logic. |
Opening it in Excel, Google Sheets or Numbers
It is one .xlsx file. There are no macros, no add-ins and nothing to install, which is what makes it portable — a macro-driven template would be Excel-only.
| App | How to open it |
|---|---|
| Microsoft Excel | Double-click the file. Excel 2016 and later, and Microsoft 365, on Windows or Mac. Nothing to enable and nothing to install. |
| Google Sheets | Go to Google Drive, click New → File upload and pick the .xlsx. Then double-click it in Drive and choose Open with → Google Sheets. To keep a native copy, use File → Save as Google Sheets. Formatting and formulas both carry over. |
| Apple Numbers (Mac, iPad, iPhone) | Numbers opens .xlsx directly — double-click it, or in Numbers use File → Open and select the file. Numbers converts it on open and will list anything it changed. To send a copy back to someone on Excel, use File → Export To → Excel. |
| LibreOffice Calc | Free, and opens the file as-is on Windows, Mac and Linux. This is what I use to recalculate every workbook when I check the maths, so it is the app these files are tested hardest in. |
Every formula in this workbook uses ordinary functions — SUM, IF, INDEX, MATCH and their relatives. Nothing here is Excel-only.
Get the workbook
$99 one-off · no subscription
- One .xlsx file, eight tabs, works in Excel, Google Sheets, Numbers and LibreOffice
- An eight-job, 30-month sample scenario already filled in
- Three separate cost payment timings and a split collection lag
- A revolving credit line with a hard ceiling, so over-runs show instead of hiding
- A stress test tab for slipping jobs and late payers
- Free lifetime updates
Instant download from Gumroad. No subscription, no account, no macros.
The arithmetic, written out
The cash flow itself is a roll-forward, and the identities are what make it trustworthy.
progress(t)  = t^n / (t^n + (1-t)^n)          # the S-curve
closing(m)   = opening(m) + net(m) + draw(m)
opening(m+1) = closing(m)
draw(m)      = enough to hold the cash floor, capped at the facility
peak need    = MAX(line of credit balance)
One subtlety worth naming: peak funding need is the peak drawn balance, not the lowest cash balance. They are different numbers, because the model keeps cash at the floor and borrows the difference — which is what an operator actually does.
How I know the numbers are right
The whole forecast is reimplemented in Python and diffed against the recalculated workbook, and then the identities are asserted — a forecast that loses or invents money is worse than no forecast. Last run: 0 numeric mismatches, 0 property failures, 0 formula errors across all 30 months.
- Closing equals opening plus net movement plus draws, every month
- Next month's opening equals this month's closing, every month — no gaps in the chain
- Collections plus retainage released equals total billed, to $0.00
- The credit line balance never goes negative and never exceeds the facility
- Draws happen only when the month would otherwise close below the floor — no spurious borrowing
- All 8 jobs complete inside the horizon
- Peak funding need equals the maximum drawn balance: $2,218,817 in month 19
Worth noting how the workbook differs from the Python prototype: the prototype said $2,032,409. The workbook says $2,218,817 because it charges interest on the drawn balance and the prototype did not. The workbook is the more complete model.
Compared with the alternatives
| Cost | Cost timings | S-curve | Credit line modelled | |
|---|---|---|---|---|
| This workbook | $99 | Three, separate | Yes, tunable | Yes, with a ceiling |
| A free cash flow template | $0 | One average lag | Straight line | No |
| Construction ERP | $300–$1,000 / month | Yes | Yes | Yes |
| Your bank's forecast form | $0 | One lag | No | No |
Questions people ask before buying
What is peak funding need?
The largest amount you will ever be out of pocket across the forecast — the deepest point of the cash trough. It is what determines how big a credit line you need. On the sample scenario it is $2,218,817, in month 19.
How can profitable jobs cause a cash problem?
Because you pay for work before you get paid for it. Wages go out weekly; customer payments arrive a month or two after invoicing; retainage arrives months after that. Overlap several jobs and those gaps stack up.
What is an S-curve and why does it matter?
It is the shape of how a job actually consumes budget — slow at the start, fast in the middle, tapering at the end. A straight-line forecast understates the middle of a job, and the middle is exactly where the cash trough forms.
Why three separate cost payment timings?
Because labour, materials and subcontractors are paid on completely different schedules. Payroll cannot wait; material invoices run about a month; subcontractors about two. Averaging them hides the part that hurts.
What does the stress test do?
Pushes the scenario — jobs slipping, customers paying late, costs over-running — so you can see how much headroom you really have. The sample is deliberately tight at 11% so the stress test has something to break.
Will it work in Google Sheets?
Yes. Upload the .xlsx to Google Drive and open it with Google Sheets. No macros or add-ins.
Can I use it on a Mac without Excel?
Yes. Apple Numbers opens the file directly, and LibreOffice Calc is free.
How many jobs and months does it cover?
Eight jobs across a 30-month horizon in the sample. You can change the jobs; the horizon is built into the model.
Related spreadsheets
Ready to stop doing this by hand?
$99 one-off · no subscription
- One .xlsx file, eight tabs, works in Excel, Google Sheets, Numbers and LibreOffice
- An eight-job, 30-month sample scenario already filled in
- Three separate cost payment timings and a split collection lag
- A revolving credit line with a hard ceiling, so over-runs show instead of hiding
- A stress test tab for slipping jobs and late payers
- Free lifetime updates
Instant download from Gumroad. No subscription, no account, no macros.