Workbook Restaurant costing
how much does that dish actually cost you?
Most costing sheets take the price on the invoice and treat it as the cost of what lands on the plate. It never is. Once you account for what gets trimmed away, some dishes turn out to cost a third more than you thought — and they are usually the popular ones.
To cost a dish properly you need three numbers per ingredient: what you paid, how much of it is actually usable after trimming, and how much of that usable amount goes on the plate. Skip the middle one and every dish involving something you peel, trim or bone comes out too cheap.
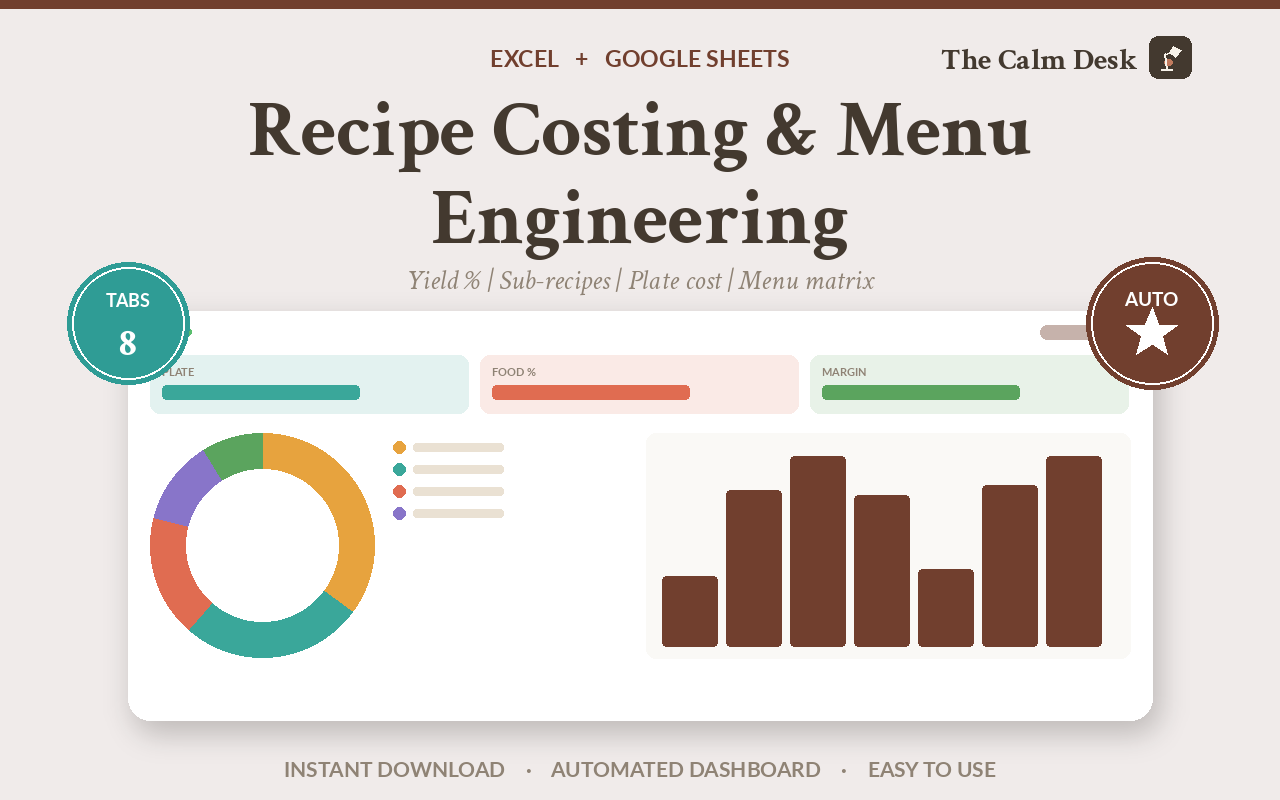
This workbook does that calculation for every ingredient, builds it up through sub-recipes into plate costs, and then sorts your menu into four groups by how popular and how profitable each dish is — so you know which to protect, which to reprice and which to cut.
The carrot problem
You buy a kilo of carrots for $2. You peel them and cut the ends off. About 800 grams is left.
So the carrot you actually cook with did not cost $2 a kilo. It cost $2.50 a kilo, because you paid for 1000 grams and can only use 800. That extra 25% is real money and it never appears on any invoice.
Now do that for a whole beef short rib, where you might lose 40% to bone and trim. Or a whole fish. Or herbs. The dishes with the most trimming are usually the ones you charge most for, so the error lands exactly where it hurts.
Most free costing sheets have a column for what you paid and a column for how much you use. They do not have a column for how much survives. Without it, every one of those dishes is undercosted, and the food cost percentage you report to yourself is fiction.
What the missing column does to one dish
Take a plate using 200g of trimmed carrot, bought at $2.00 a kilo with a 80% usable yield. Here is the same dish costed with and without the yield step.
| Cost per usable kg | Cost on the plate | What it does to your menu | |
|---|---|---|---|
| With yield accounted for | $2.50 | $0.50 | The real number. Price from here. |
| Invoice price used directly | $2.00 | $0.40 | 20% light on this ingredient alone. |
| Understated by | $0.50/kg | $0.10 | On every plate, every service |
Ten cents a plate. Two hundred covers a week. That is one ingredient on one dish, and it is roughly $1,000 a year of margin you believed you had and did not. A plate has ten or fifteen ingredients.
Why costing and menu design are the same job
Getting plate cost right is only worth doing if you then do something with it. That something is menu engineering, and it is simpler than it sounds: every dish is either popular or not, and either profitable or not. Two questions, four possible answers.
Each of those four has one obvious action, and they are completely different actions. The danger is discounting a Star or leaving a Dog on the menu for years because nobody ever put the two numbers side by side.
How to cost a plate and read your menu
List what you buy and what you pay
Pack size and price as they appear on the invoice. The workbook converts to a common unit for you, which is where a lot of hand-built sheets quietly go wrong — mixing price-per-kilo with grams-per-portion and losing a factor of a thousand.
Add the yield percentage
This is the column that does the work. Weigh it once: buy it, prep it as you normally would, weigh what is left. Whole vegetables tend to land between 70% and 90%; bone-in meat and whole fish go a lot lower. Anything you use straight from the packet is 100%.
Cost per usable unit = purchase price ÷ yield. Everything downstream uses that number, never the invoice price.
Build your preps once, use them everywhere
Your demi-glace is not an ingredient you buy, it is one you make. Cost it once as a sub-recipe and every dish that uses it picks up the right cost. Change the price of one thing in it and every affected plate updates.
Cost the plate and set the price
Plate cost against menu price gives you two figures, and they answer different questions. Food cost percentage tells you whether the dish is priced sensibly. Contribution margin — price minus cost, in money — tells you what the dish actually contributes when someone orders it.
A dish can look bad on percentage and be excellent on margin. The Price Finder tab works backwards: tell it the food cost percentage you want and it gives you the price.
Sort the menu into four groups
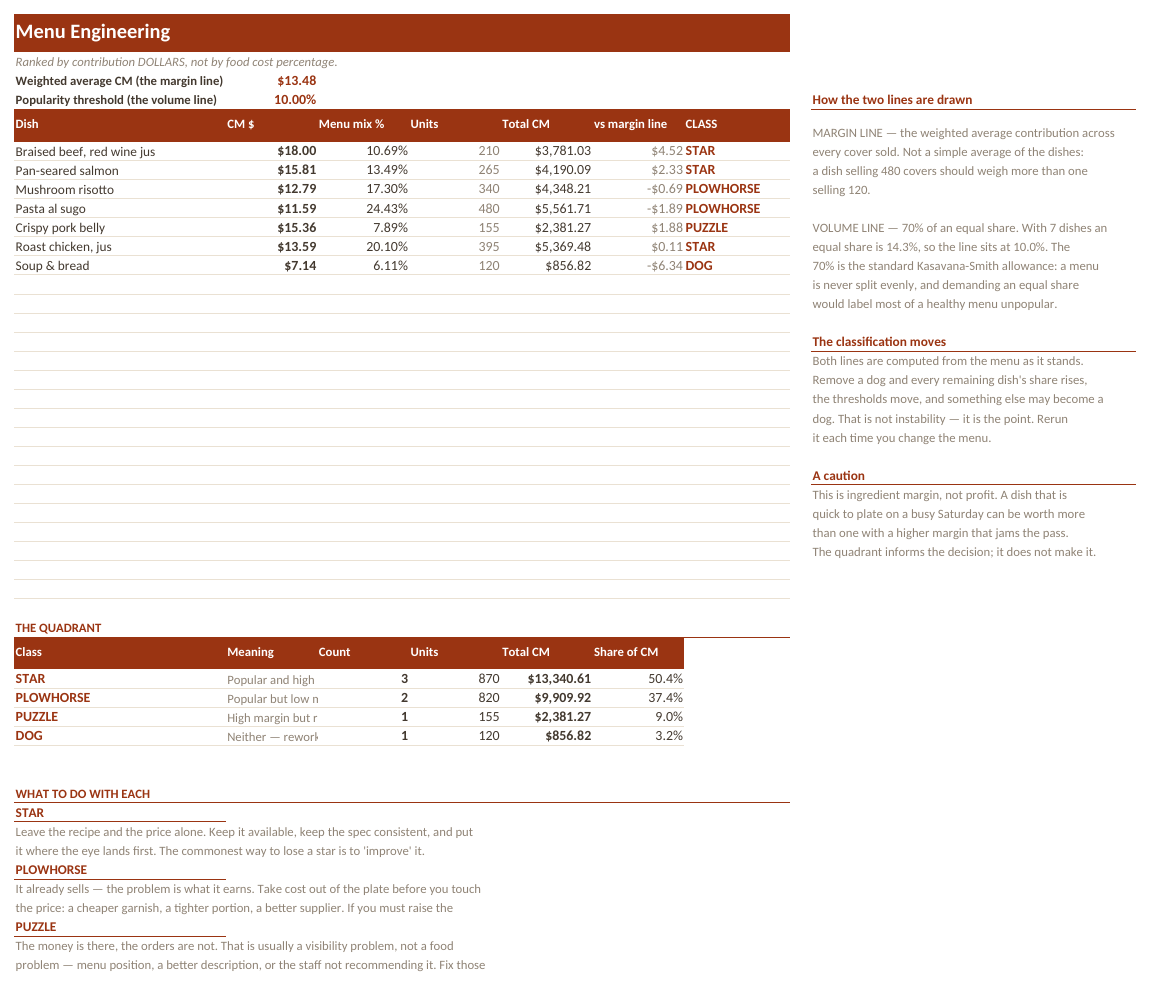
Above average on both is a Star — protect it. Popular but thin is a Plowhorse — take cost out or nudge the price. Profitable but ignored is a Puzzle — a selling problem, not a kitchen one. Neither is a Dog. The workbook does the classification from your actual sales mix.
What is inside the file
Eight tabs, seeded with a working bistro so nothing is empty when you open it. Eight sub-recipes and twelve plated dishes, fully costed.
| Tab | What it does |
|---|---|
| Start Here | What to fill in and in what order, plus how to import the file into Google Sheets. |
| Ingredients | Everything you buy, with pack size, price and the yield percentage that turns purchase price into cost per usable unit. |
| Sub-Recipes | Stocks, sauces and preps costed once, so the dishes that use them stay correct. |
| Recipes | The plates. Each one built from ingredients and sub-recipes, giving plate cost. |
| Menu | Selling price, food cost percentage and contribution margin for every dish. |
| Menu Engineering | Sorts the menu into stars, plowhorses, puzzles and dogs using your sales mix. |
| Price Finder | Works backwards — name the food cost percentage you want, get the price. |
| How It Works | Every formula, written out, including how yield feeds through the whole chain. |
Opening it in Excel, Google Sheets or Numbers
It is one .xlsx file. There are no macros, no add-ins and nothing to install, which is what makes it portable — a macro-driven template would be Excel-only.
| App | How to open it |
|---|---|
| Microsoft Excel | Double-click the file. Excel 2016 and later, and Microsoft 365, on Windows or Mac. Nothing to enable and nothing to install. |
| Google Sheets | Go to Google Drive, click New → File upload and pick the .xlsx. Then double-click it in Drive and choose Open with → Google Sheets. To keep a native copy, use File → Save as Google Sheets. Formatting and formulas both carry over. |
| Apple Numbers (Mac, iPad, iPhone) | Numbers opens .xlsx directly — double-click it, or in Numbers use File → Open and select the file. Numbers converts it on open and will list anything it changed. To send a copy back to someone on Excel, use File → Export To → Excel. |
| LibreOffice Calc | Free, and opens the file as-is on Windows, Mac and Linux. This is what I use to recalculate every workbook when I check the maths, so it is the app these files are tested hardest in. |
Every formula in this workbook uses ordinary functions — SUM, IF, INDEX, MATCH and their relatives. Nothing here is Excel-only.
Get the workbook
$59 one-off · no subscription
- One .xlsx file, eight tabs, works in Excel, Google Sheets, Numbers and LibreOffice
- A fully costed sample bistro — 8 sub-recipes and 12 plates
- Yield percentage built into every ingredient, not bolted on
- Price Finder — name your target food cost, get the price
- Free lifetime updates
Instant download from Gumroad. No subscription, no account, no macros.
The arithmetic, written out
The whole chain is four lines, and the first one is the one that matters.
cost per usable unit = purchase price / pack size / yield %
ingredient cost      = quantity on the plate * cost per usable unit
plate cost           = SUM(ingredient costs) + SUM(sub-recipe portions)
food cost %          = plate cost / selling price
contribution margin  = selling price - plate cost
A sub-recipe is the same calculation one level down: cost the batch, divide by the yield of the batch, and you have a cost per portion that behaves exactly like an ingredient.
The menu matrix then compares each dish against two averages:
popular    = share of covers >= average share
profitable = contribution margin >= average contribution margin
Note it uses contribution margin, not food cost percentage, for the profit axis. Sorting on percentage pushes you toward cheap dishes with great percentages that make very little money per cover.
How I know the numbers are right
The whole costing chain is reimplemented from scratch in Python, the real workbook is recalculated in LibreOffice, and the two are compared to nine decimal places — every ingredient's cost per usable unit, every prep, every plate, every contribution margin, every menu-mix share and every quadrant classification.
Last run: 0 mismatches, 0 property failures, 0 formula errors.
That matters more here than it looks. Yield sits at the bottom of a chain: an ingredient feeds a sub-recipe, which feeds a plate, which feeds the menu matrix. A rounding error or an inverted division at the bottom does not announce itself — it just quietly moves a dish into the wrong quadrant and you act on it.
Compared with the alternatives
| Cost | Yield column | Sub-recipes | Menu matrix | |
|---|---|---|---|---|
| This workbook | $59 | Yes | Yes, two levels | Yes |
| A free costing sheet | $0 | Almost never | Rarely | No |
| Restaurant costing platform | $70–$200 / month | Yes | Yes | Usually |
| Back of an envelope | $0 | No | No | No |
Questions people ask before buying
What is yield percentage?
The share of what you buy that you can actually cook with, after peeling, trimming or boning. If a kilo of carrots gives you 800 grams of usable carrot, the yield is 80 percent, and the real cost is your purchase price divided by 0.8.
How do I find the yield for an ingredient?
Weigh it. Buy it, prep it the way you normally would, weigh what is left, divide. Do it once per ingredient and it stays true until your supplier or your prep changes.
What is the difference between food cost percentage and contribution margin?
Food cost percentage is cost divided by price, and it tells you whether a dish is priced sensibly. Contribution margin is price minus cost in money, and it tells you what the dish actually earns when someone orders it. You need both, and the menu matrix uses margin.
Will it work in Google Sheets?
Yes. Upload the .xlsx to Google Drive and open it with Google Sheets. Nothing in this workbook is Excel-only.
Can I use it on a Mac without Excel?
Yes. Apple Numbers opens the file directly, and LibreOffice Calc is free and opens it too.
How many dishes does it hold?
Twelve plates and eight sub-recipes are filled in as a worked example. You add rows the normal way and the formulas copy down.
Does it handle sauces and stocks I make myself?
Yes, that is what the Sub-Recipes tab is for. Cost a batch once and every dish that uses it picks up the right per-portion cost automatically.
Do I need to be good at spreadsheets?
No. You type into the Ingredients, Recipes and Menu tabs. Everything else calculates. The How It Works tab explains each formula if you want to check it.
Related spreadsheets
Ready to stop doing this by hand?
$59 one-off · no subscription
- One .xlsx file, eight tabs, works in Excel, Google Sheets, Numbers and LibreOffice
- A fully costed sample bistro — 8 sub-recipes and 12 plates
- Yield percentage built into every ingredient, not bolted on
- Price Finder — name your target food cost, get the price
- Free lifetime updates
Instant download from Gumroad. No subscription, no account, no macros.