Guide Power Query
Power Query, Power Pivot — which one do I actually need?
Two features with similar names, both free inside Excel, both mentioned in the same breath. They do completely different jobs, and picking the wrong one to learn first wastes a fortnight.
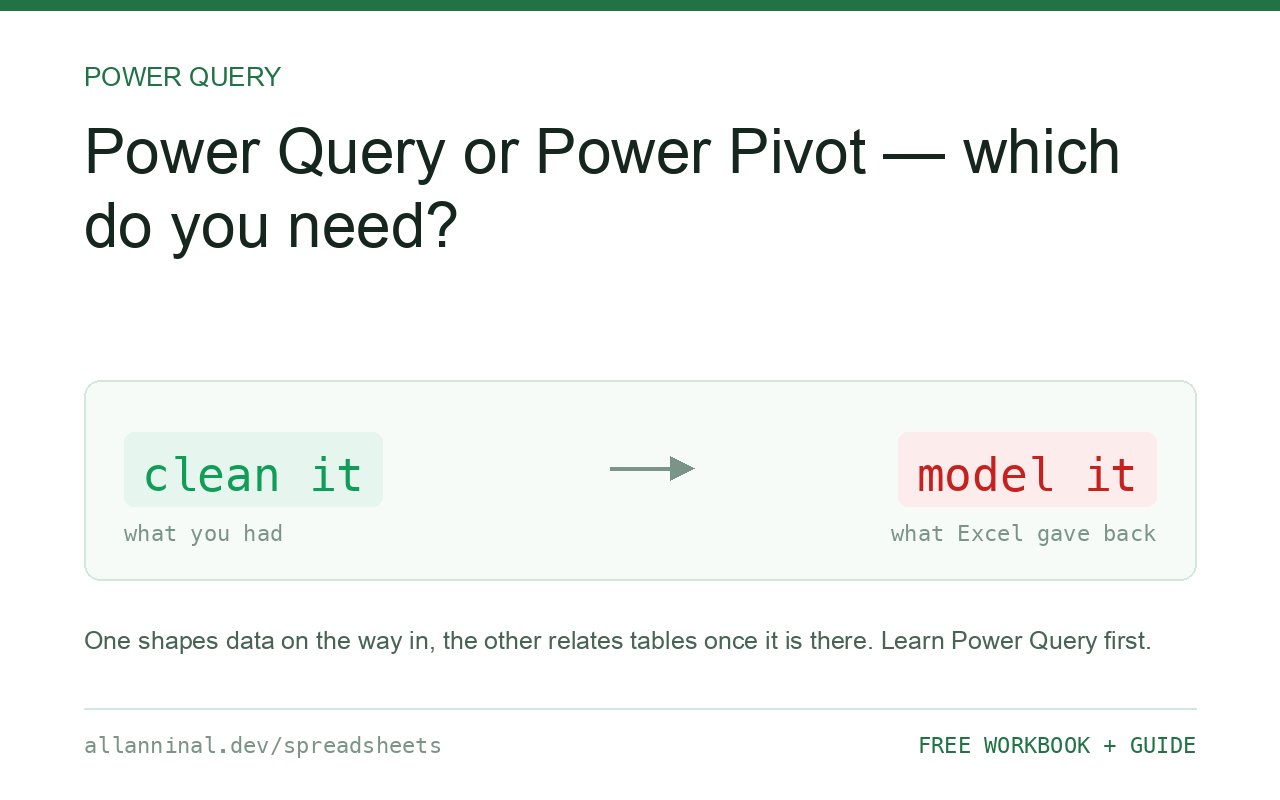
Power Query gets data in and cleans it. Power Pivot relates several tables and calculates on them. If your problem is “this file is messy and I do it every month”, you want Power Query. If it is “I have four tables and need one number across all of them”, you want Power Pivot. Learn Power Query first — almost everyone needs it, and many people never need Power Pivot at all.
Two different jobs, one confusing pair of names
The names suggest a matched pair. They are better understood as two stages of the same pipeline.
Power Query is the loading dock. It connects to files, folders, databases and web pages, and applies the same cleaning steps every time you refresh. Everything it does happens before the data reaches your workbook.
Power Pivot is the warehouse. It holds several tables at once, lets you define relationships between them — this order belongs to that customer — and calculates measures across them. Everything it does happens after the data has arrived.
Data flows one way: Power Query, then Power Pivot, then a pivot table. That order is why learning them in that order makes sense.
| What you see | What actually happened | What fixes it |
|---|---|---|
| Cleaning the same file every month | A repeatable import problem | Power Query |
| Combining forty files | An import problem | Power Query |
| Four tables, one number across all | A modelling problem | Power Pivot |
| A pivot table cannot see two tables | No relationship defined between them | Power Pivot |
| More rows than a worksheet holds | Past the ~1 million row limit | Power Pivot's Data Model |
| One tidy table, ordinary size | Neither — a pivot table is enough | Do not over-tool it |
How to choose between them
Ask where the pain is
One question sorts it: is the painful part getting the data usable, or calculating once it is?
Getting it usable — opening files, deleting heading rows, fixing types, combining sources — is Power Query. Calculating across several related tables is Power Pivot.
Learn Power Query first
Nearly everyone who uses Excel has a repeated import to deal with. Far fewer have four related tables to model. Power Query also has a much gentler start: it is mostly clicking, and it shows you the result at every step.
Power Pivot needs DAX, a formula language of its own, and it is much easier to learn against clean data — which Power Query gives you.
Use Power Pivot when relationships appear
The clearest signal: you find yourself adding a lookup column to a table purely so a pivot table can group by it. That column is standing in for a relationship, and a relationship is what Power Pivot provides.
Switch on File → Options → Add-ins → COM Add-ins → Microsoft Power Pivot, then load your queries to the Data Model instead of to sheets.
Know when you need neither
Plenty of real work needs neither. One tidy table, well under a million rows, updated by hand now and then, is served perfectly by a pivot table and a few formulas. Reaching for the heavier tools makes the workbook harder for the next person without making it better.
Everything on this page, as a workbook you can use on your own data
The Excel Data Cleanup Kit — a seven-tab workbook that finds all nine of these faults in a pasted column and hands back a cleaned version, a five-page PDF guide, and a short read-me. Free, no email required.
- Excel-Data-Cleanup-Workbook-Free.xlsx — paste a column, read the diagnosis, take the cleaned output
- Excel-Data-Survival-Guide.pdf — the eight failures, the import routine that prevents them, every formula explained
Plain .xlsx: no macros, no add-ins. Opens in Excel, Google Sheets,
Apple Numbers and LibreOffice Calc.
Where Power BI fits
Power BI is a separate product that contains both of these, plus its own visuals and a publishing service. The skills carry over almost exactly — the same Power Query editor, the same DAX. If you learn them in Excel and later move to Power BI, very little is wasted.
You do not need Power BI to use either of them. Both are built into Excel at no extra cost.
Availability
- Power Query — built into Excel 2016 and later on Windows, and Excel for Mac from 2019 with some limits. A free add-in for 2010 and 2013.
- Power Pivot — Windows only, and not in every Excel edition. Home & Student in particular does not have it.
A short vocabulary
- M — the language behind Power Query. You rarely write it; the clicks generate it.
- DAX — the formula language of Power Pivot. You do write this.
- Data Model — the in-memory store Power Pivot uses. Holds far more than a worksheet.
- Measure — a calculation defined once in the model and reusable in any pivot table, rather than a formula sitting in a cell.
Questions people ask
What is the difference between Power Query and Power Pivot?
Power Query gets data in and cleans it, before it reaches your workbook. Power Pivot relates several tables and calculates across them, after the data has arrived.
Which should I learn first?
Power Query. Almost everyone has a repeated import problem, it is mostly clicking rather than a formula language, and it gives Power Pivot the clean data that makes it easier.
Do I need Power BI to use them?
No. Both are built into Excel at no extra cost. Power BI is a separate product that includes the same two engines plus its own visuals and publishing.
When do I actually need Power Pivot?
When a pivot table needs fields from two tables at once, or when you find yourself adding a lookup column purely so a pivot can group by it. That column is standing in for a relationship.
Is Power Pivot available on a Mac?
No. Power Pivot is Windows only, and is not included in every Excel edition. Power Query is available on Mac from Excel 2019, with some limitations.
What is a measure?
A calculation defined once in the Data Model and reusable in any pivot table, rather than a formula written into a cell.
Related guides
Take the workbook with you
The Excel Data Cleanup Kit — a seven-tab workbook that finds all nine of these faults in a pasted column and hands back a cleaned version, a five-page PDF guide, and a short read-me. Free, no email required.
- Excel-Data-Cleanup-Workbook-Free.xlsx — paste a column, read the diagnosis, take the cleaned output
- Excel-Data-Survival-Guide.pdf — the eight failures, the import routine that prevents them, every formula explained
Plain .xlsx: no macros, no add-ins. Opens in Excel, Google Sheets,
Apple Numbers and LibreOffice Calc.